
Observability: What It Is and Why Your Board of Directors Should Ask About It
Operational Blind Spots in Complex Digital Architectures
At board meetings, when a critical system crashes or experiences extreme slowness, the first question is inevitable: Why did this happen, and how long will it take to resolve it? However, for Chief Information Officers (CIOs) and Operations Managers, providing a quick answer has become a frustrating challenge.
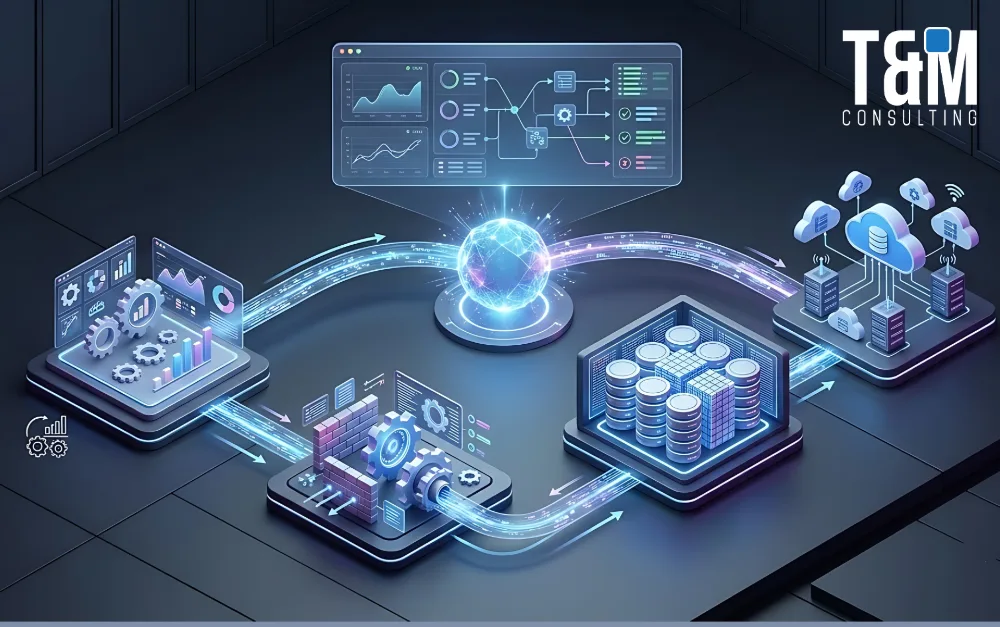
The main pain point lies in the operational blindness created by modern architectures. Companies combine their SAP ERP, Microsoft Azure cloud applications, B2B web portals, and third-party microservices. Traditional monitoring tools act like a basic car dashboard: they only light up a red warning light when the engine has already failed, but they don’t explain why it failed or predict where the next bottleneck will occur.
The Impact of “Blind Monitoring” in the Age of AI
Limiting oneself to reactive “availability” monitoring (knowing whether a server is on or off) exposes the company to silent failures that degrade the customer experience and wear down technical talent in emergency meetings with no clear findings.
This lack of visibility becomes even more critical as organizations adopt artificial intelligence capabilities. According to the global report Dynatrace: The Pulse of Agent-Based AI 2026, 69% of companies already use observability during the deployment phase of the agent-based AI lifecycle. Without a layer of deep observability, deploying AI agents or complex automations is like operating blindly, increasing the risk of hallucinations, infinite cloud queries, and uncontrolled resource consumption.
Operating without enterprise observability leads to severe consequences:
• Increased MTTR (Mean Time to Resolution): IT teams waste hours trying to isolate whether a failure originates from the cloud network, the web application code, or the transactional core in SAP.
• Silent Service Degradation: B2B billing or ordering processes that don’t fail completely but become five times slower, driving customers away.
• Cloud Budget Shock: Inability to identify which queries, services, or agents are consuming cloud infrastructure at abnormal rates.
Explanatory Guide and Glossary: Understanding Observability
To help senior management understand the qualitative leap between traditional monitoring and observability, we break down the fundamental pillars of the concept:
Traditional Monitoring | Answers: Is the system working? (Yes / No) |
Observability | Answers: Why isn’t it working, and what caused it? (MELT TELEMETRY) |
1. What Is Observability?
Observability is the ability to deduce the internal state of a complex system based solely on the data and outputs it generates. While monitoring alerts you that the application has crashed, observability shows you the exact line of code, the SAP database query, or the external API that caused the crash.
2. Executive Glossary: The 4 Pillars of Telemetry (MELT)
• M - Metrics: Numerical values measured over time (e.g., CPU usage percentage in Azure, memory usage, response time).
• E - Events: Specific, time-stamped actions that occur in the system (e.g., “user logged in,” “invoice processed in SAP”).
• L - Logs: The detailed history recorded by applications of what happened during the execution of a process.
• T - Traces: The complete path a request follows from the moment a user clicks on a B2B Web Portal, through the microservices in Microsoft Azure, and to the central database in SAP.
• AIOps (AI for IT Operations): The use of Artificial Intelligence to analyze the massive volume of MELT data in real time, detecting anomalies and autonomously correcting failures.
3. Comparative Matrix: Traditional Monitoring vs. Observability
Criterion | Traditional Monitoring | Enterprise Observability |
Approach | Detection of known faults (symptomatic). | Root-cause diagnosis and complex faults (inference). |
Perspective | Infrastructure-based (Servers/Networks). | Based on user experience and business workflow. |
Role in AI | No ability to measure non-deterministic behaviors. | Crucial: Monitors the accuracy, latency, and costs of AI agents. |
Business Outcome | Obvious reduction in downtime. | Operational resilience, cost optimization, and continuity. |
Full Visibility and Resilience with T&M Consulting
At T&M Consulting, with 12 years of experience as B2B technology integrators in Latin America (Monterrey, the Dominican Republic, and Venezuela), we help organizations implement end-to-end observability strategies that protect operations and safeguard the profitability of their cloud.
Our approach to transforming the visibility of your infrastructure includes:
• Observability Implementation on Microsoft Azure: As certified Microsoft Azure consultants, we design and implement advanced telemetry architectures using tools such as Azure Monitor and Log Analytics, unifying visibility across all your web applications and cloud services.
• End-to-End Observability for SAP: We connect the telemetry from your business processes to your SAP ERP and B2B integrations (SAP BTP), identifying bottlenecks in billing, logistics, and finance in real time.
• AI Governance and Autonomous Agents: We deploy observability solutions specifically designed to measure the performance, latency, and accuracy of your AI agents, ensuring they operate within security standards and with predictable costs.
• Cloud Cost Optimization with C3 Cloud Cost Control: We apply FinOps methodologies and our C3 Cloud Cost Control solution to ensure that telemetry data storage doesn’t drive up your monthly infrastructure bill.
Raise the level of visibility into your critical systems
Don’t let invisible failures and a lack of diagnostics impact your company’s profitability and reputation. Observability is the cornerstone that transforms technical uncertainty into business resilience.
Gain full visibility into your infrastructure and applications: Request an Azure observability and architecture assessment by emailing our team at contact@tmconsulting.mx